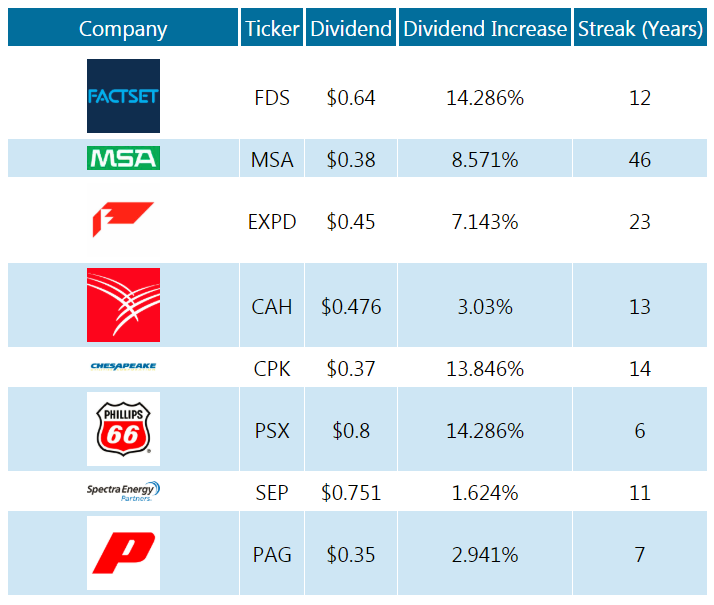
One way to identify dividend growth stocks is to look for dividend increases. Companies that pay rising dividends are likely to be financially healthy, generate consistent cash flow and regular dividend. I am interested in stocks with at least ten consecutive years of increasing annual dividend payments (Dividend Achievers). Here is a list of US companies that increased their dividends this week.
FactSet Research Systems Inc. (FDS)
Industry: Brokers & Exchanges
Sector: Financial Services
FactSet Research Systems Inc is a financial and economic data and analytics service provider. It aggregates content from hundreds of databases, reformats it, and then furnishes the data to research analysts, and other financial professionals.
FactSet Research Systems Inc. has declared quarterly dividend of $0.6400 (+14.2860% increase). It goes ex-dividend on 05-30-2018 and is payable on 06-19-2018. FactSet Research Systems Inc. has 12 years of consecutive dividend increase.
| Price |
$197.54 |
| Market Cap |
$7.679 billion |
| Annualized Dividend |
$2.56 |
| Yield |
1.296% |
| EPS(TTM) |
$7.6 |
| Payout Ratio |
33.684% |
50-day moving average |
$200.222 |
| 200-day moving average |
$187.666 |
| P/E Ratio |
26 |
| 52 week range |
$155.09 - $217.36 |
2-Year Dividend History
| DeclaredDate |
Ex-DividendDate |
RecordDate |
PayableDate |
Qualified |
Amount |
| 2018-02-07 |
2018-02-27 |
2018-02-28 |
2018-03-20 |
|
$0.56 |
| 2017-10-27 |
2017-11-29 |
2017-11-30 |
2017-12-19 |
|
$0.56 |
| 2017-08-11 |
2017-08-29 |
2017-08-31 |
2017-09-19 |
Q |
$0.56 |
| 2017-05-08 |
2017-05-26 |
2017-05-31 |
2017-06-20 |
Q |
$0.56 |
| 2017-02-06 |
2017-02-24 |
2017-02-28 |
2017-03-21 |
Q |
$0.5 |
| 2016-11-10 |
2016-11-28 |
2016-11-30 |
2016-12-20 |
Q |
$0.5 |
| 2016-08-05 |
2016-08-29 |
2016-08-31 |
2016-09-20 |
Q |
$0.5 |
| 2016-05-09 |
2016-05-26 |
2016-05-31 |
2016-06-21 |
Q |
$0.5 |
Trailing Twelve Months Earnings
| Actual EPS |
Estimated EPS |
Fiscal Period |
Y-O-Y Growth |
| $2.12 |
$2.05 |
Q2 2018 |
17% |
| $2.04 |
$1.98 |
Q1 2018 |
17% |
| $1.9 |
$1.89 |
Q4 2017 |
12% |
| $1.85 |
$1.84 |
Q3 2017 |
13% |
Peer Comparison
| Ticker |
Name |
Dividend |
Yield |
EPS (TTM) |
P/E |
P/B |
Price/Sales |
Payout Ratio |
| FDS |
FactSet Research Systems Inc. |
$2.56 |
1.296% |
$7.6 |
26 |
12.51 |
5.874 |
33.684% |
| TRI |
Thomson Reuters Corp |
$1.38 |
3.521% |
$2.51 |
15 |
2.12 |
2.63 |
54.98% |
| MORN |
Morningstar Inc. |
$1 |
0.9% |
$0 |
N/A |
5.47 |
4.968 |
N/A |
| MCO |
Moody's Corporation |
$1.76 |
1.013% |
$6.56 |
26.53 |
163.89 |
7.514 |
26.829% |
| MSCI |
MSCI Inc |
$1.52 |
0.951% |
$4.41 |
36.5 |
33.09 |
10.728 |
34.467% |
| ENV |
Envestnet Inc |
$0 |
0% |
$0.96 |
58.49 |
6.04 |
5.014 |
0.0% |
| NWSA |
News Corporation |
$0.2 |
1.206% |
$0.44 |
34.5 |
0.89 |
1.761 |
45.455% |
| FOX |
Twenty-First Century Fox Inc. |
$0.36 |
0.961% |
$1.92 |
19.52 |
3.75 |
3.166 |
18.75% |
| SPGI |
S&P Global Inc. |
$2 |
0.997% |
$7.28 |
27.47 |
7087.02 |
8.03 |
27.473% |
MSA Safety Incorporated (MSA)
Industry: Consulting & Outsourcing
Sector: Industrials
MSA Safety Inc develops, manufactures & supplies safety products that protect people & facility infrastructure. Its products include fixed gas & flame detection systems, portable gas detection instruments, head protection product & fall protection device.
MSA Safety Inc. has declared quarterly dividend of $0.3800 (+8.5710% increase). It goes ex-dividend on 05-18-2018 and is payable on 06-10-2018. MSA Safety Inc. has 46 years of consecutive dividend increase.
| Price |
$91.45 |
| Market Cap |
$3.504 billion |
| Annualized Dividend |
$1.52 |
| Yield |
1.662% |
| EPS(TTM) |
$4.13 |
| Payout Ratio |
36.804% |
50-day moving average |
$85.037 |
| 200-day moving average |
$78.93 |
| P/E Ratio |
21.93 |
| 52 week range |
$65.95 - $91.74 |
2-Year Dividend History
| DeclaredDate |
Ex-DividendDate |
RecordDate |
PayableDate |
Qualified |
Amount |
| 2018-01-09 |
2018-02-13 |
2018-02-14 |
2018-03-10 |
|
$0.35 |
| 2017-10-25 |
2017-11-13 |
2017-11-14 |
2017-12-10 |
|
$0.35 |
| 2017-08-01 |
2017-08-14 |
2017-08-16 |
2017-09-10 |
Q |
$0.35 |
| 2017-05-12 |
2017-05-19 |
2017-05-23 |
2017-06-10 |
Q |
$0.35 |
| 2017-01-10 |
2017-02-10 |
2017-02-14 |
2017-03-10 |
Q |
$0.33 |
| 2016-10-27 |
2016-11-09 |
2016-11-14 |
2016-12-10 |
Q |
$0.33 |
| 2016-08-02 |
2016-08-16 |
2016-08-18 |
2016-09-10 |
Q |
$0.33 |
| 2016-05-09 |
2016-05-19 |
2016-05-23 |
2016-06-10 |
Q |
$0.33 |
Trailing Twelve Months Earnings
| Actual EPS |
Estimated EPS |
Fiscal Period |
Y-O-Y Growth |
| $1.01 |
$0.83 |
Q1 2018 |
74% |
| $1.35 |
$1 |
Q4 2017 |
73% |
| $0.92 |
$0.79 |
Q3 2017 |
28% |
| $0.85 |
$0.87 |
Q2 2017 |
8% |
Peer Comparison
| Ticker |
Name |
Dividend |
Yield |
EPS (TTM) |
P/E |
P/B |
Price/Sales |
Payout Ratio |
| MSA |
MSA Safety Incorporated |
$1.52 |
1.662% |
$4.13 |
21.93 |
5.49 |
2.761 |
36.804% |
| MATW |
Matthews International Corporation |
$0.76 |
1.462% |
$3.59 |
14.55 |
1.95 |
1.061 |
21.17% |
| NPO |
EnPro Industries Inc |
$0.96 |
1.317% |
$2.71 |
26.87 |
1.68 |
1.097 |
35.424% |
| HI |
Hillenbrand Inc |
$0.83 |
1.779% |
$2.22 |
21.04 |
4.07 |
1.727 |
37.387% |
| FIT |
Fitbit Inc. Class A |
$0 |
0% |
$-0.68 |
-7.66 |
1.57 |
0.827 |
N/A |
Expeditors International of Washington Inc. (EXPD)
Industry: Transportation & Logistics
Sector: Industrials
Expeditors International of Washington Inc is a third-party logistics provider focused on international freight forwarding. The firm operates more than 150 full-service office locations worldwide.
Expeditors International has declared quarterly dividend of $0.4500 (+7.1430% increase). It goes ex-dividend on 05-31-2018 and is payable on 06-15-2018. Expeditors International has 23 years of consecutive dividend increase.
| Price |
$71.68 |
| Market Cap |
$12.555 billion |
| Annualized Dividend |
$0.9 |
| Yield |
1.256% |
| EPS(TTM) |
$2.73 |
| Payout Ratio |
32.967% |
50-day moving average |
$63.973 |
| 200-day moving average |
$61.485 |
| P/E Ratio |
26.5 |
| 52 week range |
$51.96 - $71.8 |
2-Year Dividend History
| DeclaredDate |
Ex-DividendDate |
RecordDate |
PayableDate |
Qualified |
Amount |
| 2017-11-07 |
2017-11-30 |
2017-12-01 |
2017-12-15 |
Q |
$0.42 |
| 2017-05-02 |
2017-05-30 |
2017-06-01 |
2017-06-15 |
Q |
$0.42 |
| 2016-11-09 |
2016-11-29 |
2016-12-01 |
2016-12-15 |
Q |
$0.4 |
| 2016-05-04 |
2016-05-27 |
2016-06-01 |
2016-06-15 |
Q |
$0.4 |
Trailing Twelve Months Earnings
| Actual EPS |
Estimated EPS |
Fiscal Period |
Y-O-Y Growth |
| $0.76 |
$0.64 |
Q1 2018 |
46% |
| $0.71 |
$0.64 |
Q4 2017 |
16% |
| $0.66 |
$0.6 |
Q3 2017 |
12% |
| $0.6 |
$0.6 |
Q2 2017 |
-5% |
Cardinal Health Inc. (CAH)
Industry: Medical Distribution
Sector: Healthcare
Cardinal Health Inc is a healthcare services company. It provides services and products for hospital systems, pharmacies, ambulatory surgery centers, clinical laboratories and physician offices.
Cardinal Health, Inc. has declared quarterly dividend of $0.4760 (+3.0300% increase). It goes ex-dividend on 06-29-2018 and is payable on 07-15-2018. Cardinal Health, Inc. has 13 years of consecutive dividend increase.
| Price |
$54.74 |
| Market Cap |
$17.227 billion |
| Annualized Dividend |
$1.905 |
| Yield |
3.48% |
| EPS(TTM) |
$5.27 |
| Payout Ratio |
36.152% |
50-day moving average |
$63.57 |
| 200-day moving average |
$64.626 |
| P/E Ratio |
10.49 |
| 52 week range |
$50.79 - $80.37 |
2-Year Dividend History
| DeclaredDate |
Ex-DividendDate |
RecordDate |
PayableDate |
Qualified |
Amount |
| 2017-11-08 |
2017-12-29 |
2018-01-02 |
2018-01-15 |
|
$0.4624 |
| 2017-08-09 |
2017-09-29 |
2017-10-02 |
2017-10-15 |
Q |
$0.4624 |
| 2017-05-03 |
2017-06-29 |
2017-07-03 |
2017-07-15 |
Q |
$0.4624 |
| 2017-02-02 |
2017-03-30 |
2017-04-03 |
2017-04-15 |
Q |
$0.4489 |
| 2016-11-03 |
2016-12-29 |
2017-01-03 |
2017-01-15 |
Q |
$0.4489 |
| 2016-08-08 |
2016-09-29 |
2016-10-03 |
2016-10-15 |
Q |
$0.4489 |
| 2016-05-04 |
2016-06-29 |
2016-07-01 |
2016-07-15 |
Q |
$0.4489 |
| 2016-02-02 |
2016-03-30 |
2016-04-01 |
2016-04-15 |
Q |
$0.387 |
Trailing Twelve Months Earnings
| Actual EPS |
Estimated EPS |
Fiscal Period |
Y-O-Y Growth |
| $1.39 |
$1.51 |
Q3 2018 |
-9% |
| $1.31 |
$1.14 |
Q2 2018 |
-2% |
| $1.09 |
$1.01 |
Q1 2018 |
-12% |
| $1.31 |
$1.24 |
Q4 2017 |
15% |
Peer Comparison
| Ticker |
Name |
Dividend |
Yield |
EPS (TTM) |
P/E |
P/B |
Price/Sales |
Payout Ratio |
| CAH |
Cardinal Health Inc. |
$1.905 |
3.48% |
$5.27 |
10.49 |
2.19 |
0.124 |
36.152% |
| HSIC |
Henry Schein Inc. |
$0 |
0% |
$3.67 |
19.87 |
3.8 |
0.864 |
0.0% |
| PDCO |
Patterson Companies Inc. |
$1.04 |
4.575% |
$2.27 |
10.05 |
1.44 |
0.518 |
45.815% |
| OMI |
Owens & Minor Inc. |
$1.04 |
6.65% |
$1.59 |
10.13 |
0.92 |
0.133 |
65.409% |
| CVS |
CVS Health Corporation |
$2 |
3.203% |
$6.23 |
10.34 |
1.61 |
0.335 |
32.103% |
| RAD |
Rite Aid Corporation |
$0 |
0% |
$-0.0 |
-464050905604255940 |
1.09 |
0.066 |
N/A |
| TFX |
Teleflex Incorporated |
$1.36 |
0.506% |
$8.75 |
30.36 |
4.75 |
5.417 |
15.543% |
| MCK |
McKesson Corporation |
$1.36 |
0.924% |
$11.82 |
12.62 |
2.55 |
0.191 |
11.506% |
| ABC |
AmerisourceBergen Corporation |
$1.52 |
1.777% |
$6.08 |
14.29 |
5.84 |
0.117 |
25.0% |
| PINC |
Premier Inc. |
$0 |
0% |
$1.79 |
17.99 |
14.24 |
1.055 |
0.0% |
| XLV |
SPDR Select Sector Fund - Health Care |
$1.213 |
1.483% |
$0 |
N/A |
3.82 |
N/A |
N/A |
Chesapeake Utilities Corporation (CPK)
Industry: Utilities - Regulated
Sector: Utilities
Chesapeake Utilities Corp is a diversified energy company engaged, through its operating divisions and subsidiaries, in regulated and unregulated energy businesses.
Chesapeake Utilities Corporation has declared quarterly dividend of $0.3700 (+13.8460% increase). It goes ex-dividend on 06-14-2018 and is payable on 07-05-2018. Chesapeake Utilities Corporation has 14 years of consecutive dividend increase.
| Price |
$76.75 |
| Market Cap |
$1.256 billion |
| Annualized Dividend |
$1.48 |
| Yield |
1.928% |
| EPS(TTM) |
$3.12 |
| Payout Ratio |
47.436% |
50-day moving average |
$72.84 |
| 200-day moving average |
$76.028 |
| P/E Ratio |
24.5 |
| 52 week range |
$66.35 - $86.35 |
2-Year Dividend History
| DeclaredDate |
Ex-DividendDate |
RecordDate |
PayableDate |
Qualified |
Amount |
| 2017-11-08 |
2017-12-14 |
2017-12-15 |
2018-01-05 |
|
$0.325 |
| 2017-08-02 |
2017-09-14 |
2017-09-15 |
2017-10-05 |
Q |
$0.325 |
| 2017-05-03 |
2017-06-13 |
2017-06-15 |
2017-07-05 |
Q |
$0.325 |
| 2016-11-02 |
2016-12-13 |
2016-12-15 |
2017-01-05 |
Q |
$0.305 |
| 2016-08-03 |
2016-09-13 |
2016-09-15 |
2016-10-05 |
Q |
$0.305 |
| 2016-05-04 |
2016-06-13 |
2016-06-15 |
2016-07-05 |
Q |
$0.305 |
Trailing Twelve Months Earnings
| Actual EPS |
Estimated EPS |
Fiscal Period |
Y-O-Y Growth |
| $1.4 |
$1.34 |
Q1 2018 |
20% |
| $0.93 |
$0.85 |
Q4 2017 |
27% |
| $0.42 |
$0.35 |
Q3 2017 |
45% |
| $0.37 |
$0.55 |
Q2 2017 |
-29% |
Peer Comparison
| Ticker |
Name |
Dividend |
Yield |
EPS (TTM) |
P/E |
P/B |
Price/Sales |
Payout Ratio |
| CPK |
Chesapeake Utilities Corporation |
$1.48 |
1.928% |
$3.12 |
24.5 |
1.7 |
1.844 |
47.436% |
| RGCO |
RGC Resources Inc. |
$0.62 |
2.301% |
$0.25 |
108.24 |
2.69 |
3.284 |
248.0% |
| NI |
NiSource Inc |
$0.78 |
3.131% |
$1.27 |
19.63 |
1.85 |
1.667 |
61.417% |
| ATO |
Atmos Energy Corporation |
$1.94 |
2.19% |
$3.59 |
24.58 |
2.06 |
3.141 |
54.039% |
| NJR |
NewJersey Resources Corporation |
$1.09 |
2.497% |
$2.82 |
15.55 |
2.56 |
1.385 |
38.652% |
| SJI |
South Jersey Industries Inc. |
$1.12 |
3.432% |
$1.77 |
18.43 |
2.12 |
2.03 |
63.277% |
| WGL |
WGL Holdings IncCommon Stock |
$2.06 |
2.34% |
$3.8 |
23.15 |
2.63 |
1.852 |
54.211% |
| SR |
Spire Inc. |
$2.25 |
3.171% |
$3.79 |
18.8 |
1.57 |
1.727 |
59.367% |
| XLU |
SPDR Select Sector Fund - Utilities |
$1.711 |
3.402% |
$0 |
N/A |
1.87 |
N/A |
N/A |
Phillips 66 (PSX)
Industry: Oil & Gas - Refining & Marketing
Sector: Energy
Phillips 66 is an oil and gas company that purchases for resale and markets refined petroleum products. Its joint venture operates facilities in the United States and the Middle East and primarily produces olefins and polyolefins.
Phillips 66 has declared quarterly dividend of $0.8000 (+14.2860% increase). It goes ex-dividend on 05-18-2018 and is payable on 06-01-2018. Phillips 66 has 6 years of consecutive dividend increase.
| Price |
$117.96 |
| Market Cap |
$54.95 billion |
| Annualized Dividend |
$3.2 |
| Yield |
2.713% |
| EPS(TTM) |
$4.86 |
| Payout Ratio |
65.844% |
50-day moving average |
$102.171 |
| 200-day moving average |
$94.47 |
| P/E Ratio |
24.23 |
| 52 week range |
$75.85 - $118.59 |
2-Year Dividend History
| DeclaredDate |
Ex-DividendDate |
RecordDate |
PayableDate |
Qualified |
Amount |
| 2018-02-07 |
2018-02-16 |
2018-02-20 |
2018-03-01 |
|
$0.7 |
| 2017-10-09 |
2017-11-16 |
2017-11-17 |
2017-12-01 |
|
$0.7 |
| 2017-07-12 |
2017-08-16 |
2017-08-18 |
2017-09-01 |
Q |
$0.7 |
| 2017-05-03 |
2017-05-16 |
2017-05-18 |
2017-06-01 |
Q |
$0.7 |
| 2017-02-08 |
2017-02-16 |
2017-02-21 |
2017-03-01 |
Q |
$0.63 |
| 2016-10-07 |
2016-11-15 |
2016-11-17 |
2016-12-01 |
Q |
$0.63 |
| 2016-07-13 |
2016-08-16 |
2016-08-18 |
2016-09-01 |
Q |
$0.63 |
| 2016-05-04 |
2016-05-16 |
2016-05-18 |
2016-06-01 |
Q |
$0.63 |
Trailing Twelve Months Earnings
| Actual EPS |
Estimated EPS |
Fiscal Period |
Y-O-Y Growth |
| $1.04 |
$0.91 |
Q1 2018 |
86% |
| $1.07 |
$0.86 |
Q4 2017 |
569% |
| $1.66 |
$1.62 |
Q3 2017 |
58% |
| $1.09 |
$1.02 |
Q2 2017 |
16% |
Peer Comparison
| Ticker |
Name |
Dividend |
Yield |
EPS (TTM) |
P/E |
P/B |
Price/Sales |
Payout Ratio |
| PSX |
Phillips 66 |
$3.2 |
2.713% |
$4.86 |
24.23 |
2.5 |
0.531 |
65.844% |
| CLMT |
Calumet Specialty Products Partners L.P. |
$0 |
0% |
$-0.65 |
-11.08 |
4.62 |
0.196 |
N/A |
| VLO |
Valero Energy Corporation |
$3.2 |
2.795% |
$5.3 |
21.63 |
2.26 |
0.502 |
60.377% |
| XOM |
Exxon Mobil Corporation |
$3.28 |
4.014% |
$3.68 |
22.09 |
1.8 |
1.387 |
89.13% |
| CVX |
Chevron Corporation |
$4.48 |
3.478% |
$4.57 |
28.41 |
1.44 |
1.768 |
98.031% |
| MPC |
Marathon Petroleum Corporation |
$1.84 |
2.373% |
$3.93 |
19.68 |
2.38 |
0.461 |
46.819% |
| HFC |
HollyFrontier Corporation |
$1.32 |
1.957% |
$3.27 |
20.68 |
2.15 |
0.786 |
40.367% |
| ANDV |
Andeavor |
$2.36 |
1.678% |
$5.68 |
24.68 |
2.2 |
0.549 |
41.549% |
Spectra Energy Partners LP representing Limited Partner Interests (SEP)
Industry: Oil & Gas - Midstream
Sector: Energy
Spectra Energy Partners LP is a Houston-based master limited partnership. The company owns and operates natural gas transmission, gathering and storage assets, and crude oil transportation and storage assets in United States and Canada.
Spectra Energy Partners, LP has declared quarterly dividend of $0.7510 (+1.6240% increase). It goes ex-dividend on 05-18-2018 and is payable on 05-30-2018. Spectra Energy Partners, LP has 11 years of consecutive dividend increase.
| Price |
$33.19 |
| Market Cap |
$16.093 billion |
| Annualized Dividend |
$3.005 |
| Yield |
9.054% |
| EPS(TTM) |
$3.93 |
| Payout Ratio |
76.463% |
50-day moving average |
$34.928 |
| 200-day moving average |
$39.901 |
| P/E Ratio |
8.39 |
| 52 week range |
$31.16 - $46.47 |
2-Year Dividend History
| DeclaredDate |
Ex-DividendDate |
RecordDate |
PayableDate |
Qualified |
Amount |
| 2018-02-08 |
2018-02-16 |
2018-02-20 |
2018-02-28 |
|
$0.73875 |
| 2017-11-01 |
2017-11-10 |
2017-11-13 |
2017-11-29 |
|
$0.72625 |
| 2017-08-02 |
2017-08-11 |
2017-08-15 |
2017-08-29 |
|
$0.71375 |
| 2017-05-04 |
2017-05-11 |
2017-05-15 |
2017-05-26 |
|
$0.70125 |
| 2017-02-07 |
2017-02-15 |
2017-02-17 |
2017-02-28 |
|
$0.68875 |
| 2016-11-02 |
2016-11-09 |
2016-11-14 |
2016-11-29 |
|
$0.67625 |
| 2016-08-03 |
2016-08-11 |
2016-08-15 |
2016-08-26 |
|
$0.66375 |
| 2016-05-04 |
2016-05-12 |
2016-05-16 |
2016-05-27 |
|
$0.65125 |
Trailing Twelve Months Earnings
| Actual EPS |
Estimated EPS |
Fiscal Period |
Y-O-Y Growth |
| $0.86 |
$0.83 |
Q1 2018 |
-3% |
| $0.82 |
$0.84 |
Q4 2017 |
1% |
| $1.41 |
$0.82 |
Q3 2017 |
86% |
| $0.84 |
$0.79 |
Q2 2017 |
15% |
Peer Comparison
| Ticker |
Name |
Dividend |
Yield |
EPS (TTM) |
P/E |
P/B |
Price/Sales |
Payout Ratio |
| SEP |
Spectra Energy Partners LP representing Limited Partner Interests |
$3.005 |
9.054% |
$3.93 |
8.39 |
1.37 |
12.669 |
76.463% |
| ENB |
Enbridge Inc |
$2.684 |
8.104% |
$1.6 |
21.1 |
1.4 |
1.647 |
167.75% |
| TRP |
TransCanada Corporation |
$2.76 |
6.311% |
$2.55 |
17.17 |
2.25 |
2.868 |
108.235% |
| EPD |
Enterprise Products Partners L.P. |
$1.71 |
6.243% |
$1.36 |
20.05 |
2.58 |
1.864 |
125.735% |
| WMB |
Williams Companies Inc. (The) |
$1.36 |
5.096% |
$0.67 |
40.51 |
2.32 |
2.699 |
202.985% |
| BWP |
Boardwalk Pipeline Partners LP |
$0.4 |
3.899% |
$1.26 |
8.1 |
0.51 |
1.898 |
31.746% |
| DCP |
DCP Midstream LP |
$3.12 |
8.016% |
$0.28 |
139.68 |
0.75 |
0.641 |
1114.286% |
| EQT |
EQT Corporation |
$0.12 |
0.232% |
$1.95 |
26.05 |
1.16 |
3.71 |
6.154% |
| KMI |
Kinder Morgan Inc. |
$0.8 |
4.848% |
$0.72 |
22.93 |
1.08 |
2.649 |
111.111% |
Penske Automotive Group Inc. (PAG)
Industry: Autos
Sector: Consumer Cyclical
Penske Automotive Group Inc is a transportation services company. It operates automotive and commercial vehicle dealership in the United States and Western Europe & distributes commercial vehicles, diesel engines and related parts.
Penske Automotive Group, Inc. has declared quarterly dividend of $0.3500 (+2.9410% increase). It goes ex-dividend on 05-18-2018 and is payable on 06-01-2018. Penske Automotive Group, Inc. has 7 years of consecutive dividend increase.
| Price |
$46.8 |
| Market Cap |
$3.977 billion |
| Annualized Dividend |
$1.4 |
| Yield |
2.991% |
| EPS(TTM) |
$4.63 |
| Payout Ratio |
30.238% |
50-day moving average |
$45.013 |
| 200-day moving average |
$45.835 |
| P/E Ratio |
10.17 |
| 52 week range |
$38.33 - $54.83 |
2-Year Dividend History
| DeclaredDate |
Ex-DividendDate |
RecordDate |
PayableDate |
Qualified |
Amount |
| 2018-01-30 |
2018-02-09 |
2018-02-12 |
2018-03-01 |
|
$0.34 |
| 2017-10-11 |
2017-11-09 |
2017-11-10 |
2017-12-01 |
|
$0.33 |
| 2017-07-26 |
2017-08-08 |
2017-08-10 |
2017-09-01 |
Q |
$0.32 |
| 2017-05-10 |
2017-05-18 |
2017-05-22 |
2017-06-01 |
Q |
$0.31 |
| 2017-02-09 |
2017-02-15 |
2017-02-20 |
2017-03-01 |
Q |
$0.3 |
| 2016-10-19 |
2016-11-08 |
2016-11-10 |
2016-12-01 |
Q |
$0.29 |
| 2016-07-27 |
2016-08-08 |
2016-08-10 |
2016-09-01 |
Q |
$0.28 |
| 2016-05-04 |
2016-05-12 |
2016-05-16 |
2016-06-01 |
Q |
$0.27 |
Trailing Twelve Months Earnings
| Actual EPS |
Estimated EPS |
Fiscal Period |
Y-O-Y Growth |
| $1.25 |
$1.12 |
Q1 2018 |
29% |
| $1.01 |
$1 |
Q4 2017 |
11% |
| $1.1 |
$1.07 |
Q3 2017 |
7% |
| $1.27 |
$1.2 |
Q2 2017 |
14% |
Peer Comparison
| Ticker |
Name |
Dividend |
Yield |
EPS (TTM) |
P/E |
P/B |
Price/Sales |
Payout Ratio |
| PAG |
Penske Automotive Group Inc. |
$1.4 |
2.991% |
$4.63 |
10.17 |
1.6 |
0.179 |
30.238% |
| CPRT |
Copart Inc. |
$0 |
0% |
$1.34 |
41.24 |
9.38 |
9.93 |
0.0% |
| CRMT |
America's Car-Mart Inc. |
$0 |
0% |
$2.59 |
20.87 |
1.62 |
0.985 |
0.0% |
| RUSHA |
Rush Enterprises Inc. Class A Common Stock |
$0 |
0% |
$2.59 |
16.33 |
1.58 |
0.335 |
0.0% |
| LAD |
Lithia Motors Inc. |
$1.16 |
1.208% |
$8.68 |
11.09 |
2.13 |
0.228 |
13.364% |
| AN |
AutoNation Inc. |
$0 |
0% |
$3.97 |
11.59 |
1.71 |
0.196 |
0.0% |
| GPI |
Group 1 Automotive Inc. |
$1.04 |
1.528% |
$7.91 |
8.63 |
1.22 |
0.125 |
13.148% |
| SAH |
Sonic Automotive Inc. |
$0.24 |
1.191% |
$1.9 |
10.74 |
1.13 |
0.087 |
12.632% |
| ABG |
Asbury Automotive Group Inc |
$0 |
0% |
$6.8 |
10.29 |
3.39 |
0.223 |
0.0% |
| KMX |
CarMax Inc |
$0 |
0% |
$3.54 |
18.02 |
3.44 |
0.689 |
0.0% |
| CAR |
Avis Budget Group Inc. |
$0 |
0% |
$3.11 |
13.95 |
7.48 |
0.41 |
0.0% |
Note: Data provided for free by
IEX


Alas, I'm not invested in any of those companies Div Geek. But, I'm looking forward to the next company in my portfolio that chooses to raise its dividend.
ReplyDeleteNice list, but like DP I don't own any DG. I used to own MSA, but decided to sell it a couple years back. Tom
ReplyDeleteGeek -
ReplyDeleteThank you again for sharing, without this, I wouldn't have known CAH actually increased their dividend, thank you!!
-Lanny