Dividend Growth characteristics of my portfolio

Recently I came across a comment regarding dividend ETFs. “Most div ETFs never raise their dividend payout = NO growing dividend”. Since my portfolio is exclusively invested in indexed ETFs (not necessarily dividend based) I was interested in understanding the dividend growth characteristic of my portfolio and determine if my portfolio qualifies as a dividend growth portfolio.
One of the key characteristic of a dividend growth stock is quarter on quarter dividend increases. Dividends aristocrats are stocks that have had at least 25 consecutive years of dividend increases. Interestingly even the ETF which tracks the dividend aristocrats does not have consecutive quarterly increases. To makes sense of the dividends from ETF one needs to look at the yearly dividends. This reduces the noise generated from the stocks which constitute the ETF.
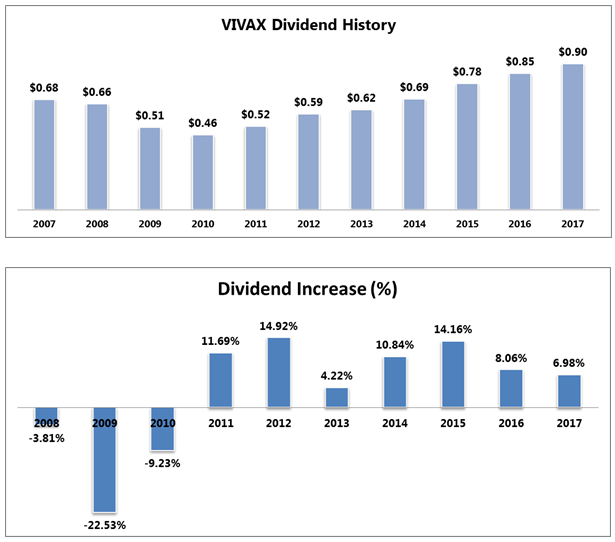
Vanguard Value Index Fund (VIVAX) is 24.76% of my portfolio. VIVAX seeks to track the performance of the CRSP US Large Cap Value Index, which measures the investment return of large-capitalization value stocks. VIVAX had a big drop in dividends in 2009 and two smaller drops in 2008/2010. Between 2007 and 2017 VIVAX had an average annual dividend increase of 3.53%. VIVAX has a 7-year dividend increase streak with annual dividend increase of 10.12%.
Vanguard High Dividend Yield Index Fund (VHDYX) is 8.78% of my portfolio. This is the only fund that I own which focusses exclusively on dividends (in particular high yielding stocks). VHDYX tracks the performance of the FTSE® High Dividend Yield Index. Between 2007 and 2017 VHDYX had an average annual dividend increase of 6.75%. VHDYX has a 7-year dividend increase streak with annual dividend increase of 11.55%. In addition VHDYX has an awesome yield of 3.08%!

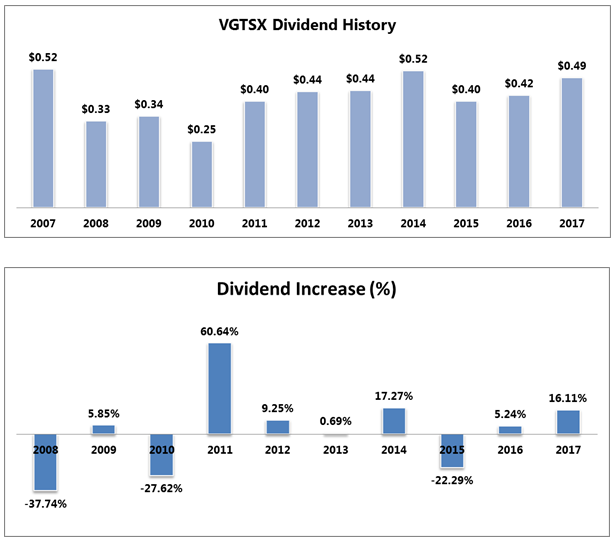
Vanguard Total International Stock Index Fund (VGTSX) constitutes 25.83% of my portfolio. VGTSX seeks to track the performance of the FTSE Global All Cap ex US Index, which measures the investment return of stocks issued by companies located outside the United States. The drop in dividends is brutal, especially a 37% drop in 2008. The recovery in 2011 pretty much wiped out the dividend drops in 2008 and 2010. Between 2007 and 2017 VGTSX had an average annual dividend increase of 2.74%. VGTSX does not have a dividend increase streak. However, I like VGTSX for its consistency (banded). The average yearly dividend is $0.413 and is very close to the median $0.422.
Vanguard S&P 500 Index Fund (VFINX) constitutes 40.63% of my portfolio. VFINX is first ever index fund and provides a low-cost exposure to 500 of the largest U.S. companies. VFINX had a 16% drop in dividends in 2009. Between 2007 and 2017 VFINX had an average annual dividend increase of 5.83%. This is phenomenal as VFINX provides exposure to 80% of the US stock market. VFINX provides solid diversification with nice dividend growth. VFINX has a 7-year dividend streak and has an annual dividend increase of 11.47%!

Between 2007 and 2017 my portfolio had an average annual dividend increase of 5.11%. 7 out of the 10 years had dividend increases. The years with dividend decreases coincided with the great recession. Overall my portfolio has had a 7-year dividend increase streak with average dividend increase of 11.27%. 11.27% is much more than the inflation and provides an awesome organic dividend increase to my portfolio.

In conclusion it is definitely possible to dividend growth portfolio using ETFs (based on annual dividends). ETF dividends might be subjected to drops across years. However, over a 10-year period the dividend drops get balanced out.


nice post.
ReplyDeletegreat to see the dividend growth of your etfs.
keep it up!
cheers